A few years ago, I heard about Glassbox, an automated troubleshooting tool for Java apps. The Google TechTalk seemed interesting (if a little long) and I was reasonably impressed when I plugged it into my own apps and it made (mostly) helpful suggestions on what may be causing bottlenecks. The tagline Just tells you what broke™ summed up the product perfectly. It didn’t go into unnecessary detail regarding CPU cycles, memory usage, garbage collections, locks, threads and so on. It just showed nice helpful messages like “Slow operation. Cause: Slow database operation”.
Unfortunately, this open source project has ground to a halt and there have been no new releases since 2008. And unfortunately it never quite managed to become completely usable. I’ve tried installing it again recently on a couple of different setups (WebSphere / IBM JDK 1.5 and Tomcat 6 / Oracle JDK 1.6) but never got it doing anything actually useful.
I now have a new project that I suspect is running poorly. There’s probably some problem with the database or nested loops or something like that. I don’t know exactly where the problem is though. I’d like to be able to use a tool like Glassbox to point me in the right direction. I don’t need it to solve my problem for me. I just need to know what to do next. Do I run a heap analysis or do I check my database indexing? So I’ve been looking for replacements for Glassbox.
Standard profiling tools
A number of good profiling tools exist for Java. I’ve already looked at NetBeans Profiler and Eclipse MAT for memory usage and heap analysis. I would add VisualVM to that list. These are all good tools for monitoring memory usage, object allocation, thread activity and garbage collection. If that’s were your problems lie that’s great. However, they’re not so great for telling you if some method is getting called too often, if it’s just plain slow or of the problem is outside of Java code – a slow database or remote call for example. All it will tell you is that your application is allocating a lot of java.lang.Strings.
AppDynamics
AppDynamics is a commercial Application Performance Management (APM) tool for Java applications. It is intended to monitor running applications including live production apps. It will discover problems within Java code and with external components such as back end services and databases. The Pro edition is intended for analysis of distributed systems using multiple JVMs. The free Lite edition is limited to a single JVM but still very powerful.
I found it very easy to set up. Just configure the -javaagent parameter on your application’s JVM to use the AppDynamics server monitor jar. The viewer app launches separately in its own Jetty and can be accessed from a browser.
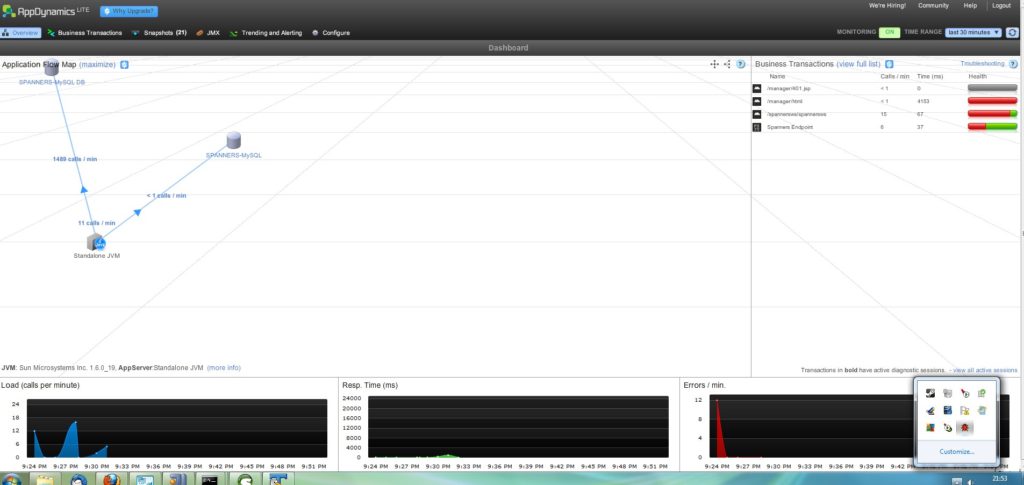
The high level dashboard view shows your application map with your Java app in the centre and external databases / services connected around it. The dashboard also shows a list of discovered business transactions and an overview of recent traffic and health.

When you drill down to the details of any of the business transactions, a list of captured requests is shown. AppDynamics will capture all slow requests as well as periodic sampling of normal requests. You can browse the captured requests and inspect the call graph, hotspots and SQL calls. Unfortunately the SQL calls are not integrated with the call graph and hotspot views. You can’t see what Java code calls what SQL. If your transaction isn’t too complicated this won’t be an issue. You can still see – in seperate views – exactly how long each Java method and each SQL call takes.


At a higher level, AppDynamics can constantly monitor your applications and report on trends and even send email notifications if service levels drop below configured levels. This may be of limited use in the free Lite version though as it will hold only two hours of diagnostic data.
Generally I’ve found AppDynamics to be very smart. It’s able to find and learn the architecture of your application without user configuration. It can analyse application performance without any manual instrumenting of app code or even redeployment. It can learn the normal behaviour of the app and alert you to what it considers abnormal behaviour. This makes it an ideal first pass tool.
I particularly like that it’s application-centric rather than code-centric. By that I mean that you start with your application, then drill down to each business transaction (service or page request) rather than start with a Java package or class or a heap dump. If I know that there’s a problem with one of my services, I don’t want a heap dump of my whole application nor do I want to guess what class may be causing the issue. I want something that just tells me what broke.
[…] I’ve used AppDynamics in the past to diagnose application performance issues in development code. It’s a great application but designed primarily for complex production systems. The standard use case is to identify performance issues after they become a problem. So you’d leave it monitoring your production system and wait for it to alert you when something goes wrong. If and when something does go wrong, it’s great at identifying the problem but we’d rather have known about it before it landed in production. Preferably before it landed in test too. […]