ZeroTurnaround, the smart kids behind JRebel, have launched a new product: XRebel. And boy, it’s a good one! It’s described as “X-Ray glasses for your webapp”. It’s a performance profiler with features previously only seen in serious application performance monitoring (APM) solutions such as AppDynamics and New Relic.
XRebel vs APM
I’ve used AppDynamics in the past to diagnose application performance issues in development code. It’s a great application but designed primarily for complex production systems. The standard use case is to identify performance issues after they become a problem. So you’d leave it monitoring your production system and wait for it to alert you when something goes wrong. If and when something does go wrong, it’s great at identifying the problem but we’d rather have known about it before it landed in production. Preferably before it landed in test too.
XRebel is much lighter and designed to be run during development and debugging. It’s has the same ability to identify the causes of performance issues but is much lighter and simpler to use. It’s also considerably cheaper. Of course, it doesn’t have nearly the same features as a full APM but you can’t have everything.
Running XRebel
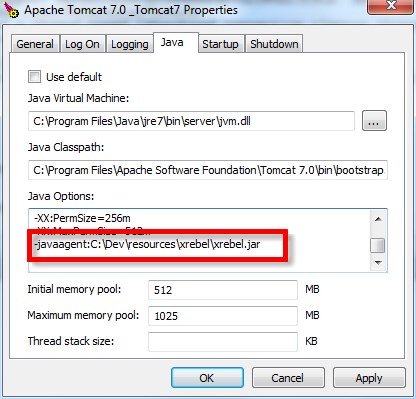
Setting up XRebel takes around 1 minute. No, seriously. The 14 day free trial will give you a zip file containing the xrebel.jar file. Point your application server at the jar as a javaagent option. In Tomcat, it looks like this:
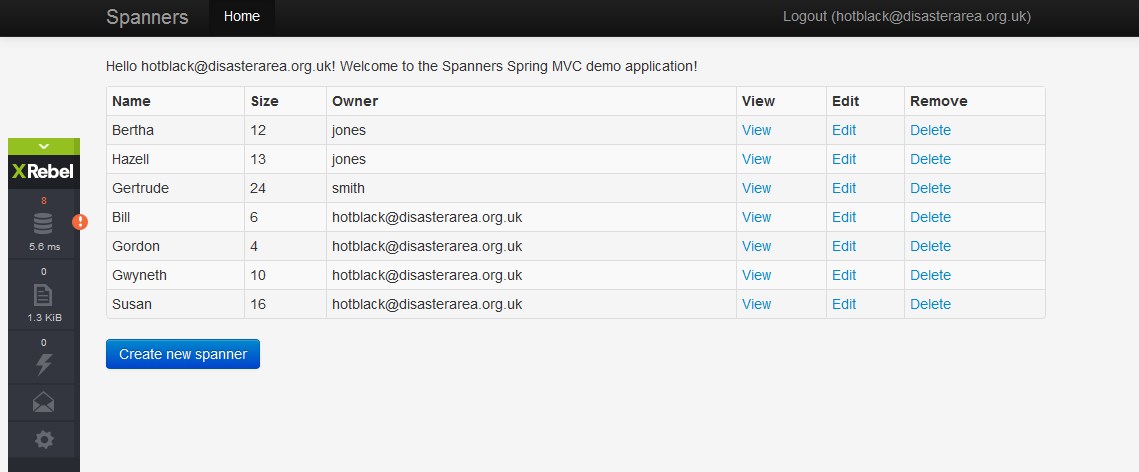
Restart Tomcat and run your application. Now that the XRebel agent is active, it will add a widget to your pages (using magic or something!). The widget shows key performance information including number of database calls and the size of the session data.
XRebel can also be configured to alert on certain conditions – too many database calls, session data size too big and so on.
Have I done something stupid?
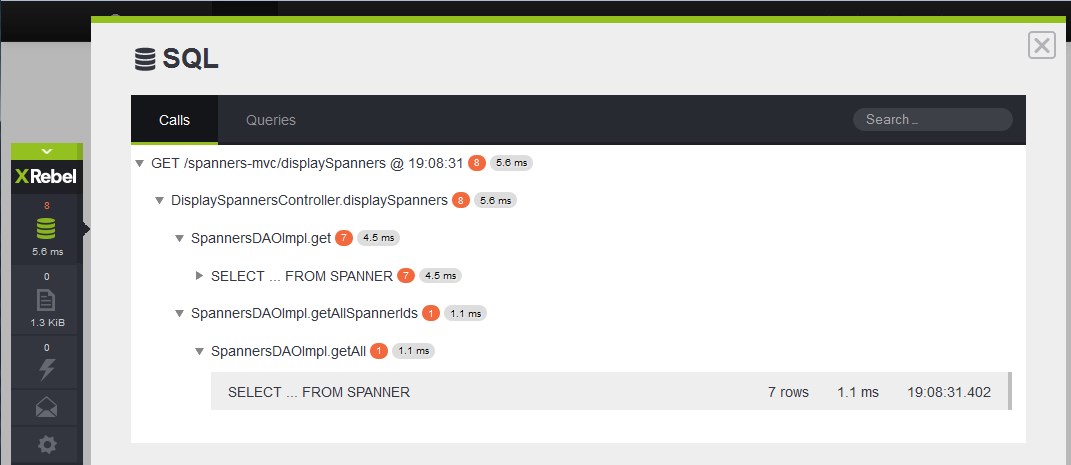
The widget above shows that 8 database queries were used to draw the page. That seems an awful lot for such a simple page. Clicking on the alert shows this:
Hang on, SpannersDaoImpl.get seems to be called 7 times from the DisplaySpannersController. That’s not right. A quick glance at the code reveals a design mistake:
@RequestMapping(value = "/displaySpanners", method = RequestMethod.GET)
public ModelAndView displaySpanners() {

	List<Spanner> allSpanners = new ArrayList<Spanner>();

	// Load the IDs of all spanners from database
	List<Integer> spannerIds = spannersDAO.getAllSpannerIds();

	// For each spanner id...
	for (Integer spannerId : spannerIds) {
		// Load the spanner object from the database
		Spanner spanner = spannersDAO.get(spannerId);
		allSpanners.add(spanner);
	}

	return new ModelAndView(VIEW_DISPLAY_SPANNERS, MODEL_ATTRIBUTE_SPANNERS, allSpanners);
}
We’re loading each spanner individually from the database rather than loading the whole lot in a single query.
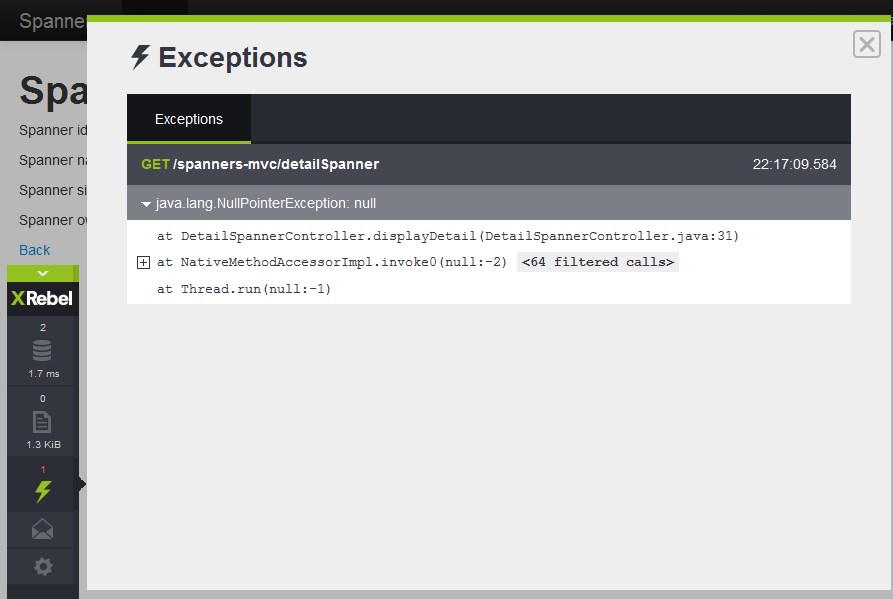
XRebel can also see exceptions thrown by the application even if they don’t bubble up to the front end. For example, if I try to open the detailSpanner page for a spanner id that’s not in the database, a blank screen is shown. XRebel shows why:
Here’s the offending code:
@RequestMapping(value = "/detailSpanner", method = RequestMethod.GET)
public ModelAndView displayDetail(@RequestParam int id) throws SpannerNotFoundException {

	// Fetch the spanner
	Spanner spanner = spannersDAO.get(id);

	// XRebel demo - cause a NPE when spanner is null
	System.out.println("Spanner retrieved: " + spanner.toString());

	return new ModelAndView(VIEW_DETAIL_SPANNER, MODEL_SPANNER, spanner);
}
Why use XRebel
XRebel is not a substitute for full stack performance testing. It won’t catch many errors that can be seen only on an end-to-end integration test environment or on a full data set environment. However, leaving XRebel running on a development environment will very quickly highlight silly mistakes at exactly the time when they’re cheapest to fix. XRebel can be used for the same reason as unit testing is performed – it is far cheaper to fix mistakes as the code is being worked on than it is to fix them when they get to test or production environments.
Database query strategies and Hibernate queries in particular are so easy to get wrong. Put the wrong query inside the wrong loop and the database will be queried 100 times instead of 10, maybe 10000 times instead of 100. XRebel gives an instant view into this kind of mistake. It also allows developers to make informed decisions about what to optimise or cache based on real data, not guesswork.
In a complex system it’s simply impossible to know what the application is doing on every request unless you go in and look. In the past this has involved complex APM tools or custom instrumentation. Often, this sort of analysis is just skipped altogether. With XRebel it’s now very easy.


Thanks for a great write-up! We have some exciting things coming up, so keep tuned in September!
can xrebel work with maven tomcat plugin? with IDEA
I would expect so but I’ve never tried this. XRebel works by instrumenting your JVM using the -javaagent option. A quick look on StackOverflow suggests that this should be possible. Specifically, set the Java agent in your MAVEN_OPTS environment variable. Something like this:
export MAVEN_OPTS=”-javaagent:path/to/xrebel.jar”
I can’t promise this will work but worth a try.
Can xrebel work with SpringBoot3 ,undertow? with IDEA .Actually, I have some problems. Thanks
undertow-servlet
2.3.8.Final
2023-11-14 16:42:21.656 XRebel: ERROR Class ‘io.undertow.servlet.spec.HttpServletResponseImpl’ could not be processed by com.zeroturnaround.xrebel.reqint.http.XrHttpServletResponseCBP@null: com.zeroturnaround.xrebel.bundled.javassist.NotFoundException: setStatus(..) is not found in io.undertow.servlet.spec.HttpServletResponseImpl
at com.zeroturnaround.xrebel.bundled.javassist.CtClassType.getDeclaredMethod(XRebel:1363)
at com.zeroturnaround.xrebel.reqint.http.XrHttpServletResponseCBP.a(XRebel:88)
at com.zeroturnaround.xrebel.reqint.http.XrHttpServletResponseCBP.process(XRebel:71)
at com.zeroturnaround.xrebel.cbp.JavassistClassBytecodeProcessor.process(XRebel:48)